This article is a translation of the original article which was published at the beginning of May. To make up for the backgroud of this article, Cookpad is mid-size technology company having 200+ product developes, 10+ teams, 90 million monthly average users. https://www.cookpadteam.com/
Hello, this is Taiki from developer productivity team. For this time, I would like to introduce about the knowledge obtained by building and using a service mesh at Cookpad.
For the service mesh itself, I think that you will have full experience with the following articles, announcements and tutorials:
- https://speakerdeck.com/taiki45/observability-service-mesh-and-microservices
- https://buoyant.io/2017/04/25/whats-a-service-mesh-and-why-do-i-need-one/
- https://blog.envoyproxy.io/service-mesh-data-plane-vs-control-plane-2774e720f7fc
- https://istioio.io/docs/setup/kubernetes/quick-start.html
- https://www.youtube.com/playlist?list=PLj6h78yzYM2P-3-xqvmWaZbbI1sW-ulZb
Our goals
We introduced a service mesh mainly to solve operational problems such as troubleshooting, capacity planning, and keeping system reliability. In particular:
- Reduction of management cost of services
- Improvement of Observability*1*2
- Building a better fault isolation mechanism
As for the first one, there was a problem that it became difficult to grasp as to which service and which service was communicating, where the failure of a certain service propagated, as the scale expanded. I think that this problem should be solved by centrally managing information on where and where they are connected.
For the second one, we further digged the first one, which was a problem that we do not know the status of communication between one service and another service easily. For example, RPS, response time, number of success / failure status, timeout, status of circuit breaker, etc. In the case where two or more services refer to a certain backend service, resolution of metrics from the proxy or load balancer of the backend service was insufficient because they were not tagged by request origin services.
For the third one, it was an issue that "fault isolation configuration has not been successfully set". At that time, using the library in each application, setting of timeout, retry, circuit breaker were done. But to know what kind of setting, it is necessary to see application code separately. There is no listing and situation grasp and it was difficult to improve those settings continuously. Also, because the settings related to Fault Isolation should be improved continuously, it was better to be testable, and we wanted such a platform.
In order to solve more advanced problems, we also construct functions such as gRPC infrastructure construction, delegation of processing around distribution tracing, diversification of deployment method by traffic control, authentication authorization gateway, etc. in scope. This area will be discussed later.
Current status
The service mesh in the Cookpad uses Envoy as the data-plane and created our own control-plane. Although we initially considered installing Istio which is already implemented as a service mesh, nearly all applications in the Cookpad are operating on a container management service called AWS ECS, so the merit of cooperation with Kubernetes is limited. In consideration of what we wanted to realize and the complexity of Istio's software itself, we chose the path of our own control-plane which can be started small.
The control-plane part of the service mesh implemented this time consists of several components. I will explain the roles and action flow of each component:
- A repository that centrally manages the configuration of the service mesh.
- Using the gem named kumonos, the Envoy xDS API response JSON is generated
- Place the generated response JSON on Amazon S3 and use it as an xDS API from Envoy
The reason why the setting is managed in the central repository is that,
- we'd like to keep track of change history with reason and keep track of it later
- we would like to be able to review changes in settings across organizations such as SRE team
Regarding load balancing, initally, I designed it by Internal ELB, but the infrastructure for gRPC application went also in the the requirement *3, we've prepared client-side load balancing by using SDS (Service Discovery Service) API *4. We are deploying a side-car container in the ECS task that performs health check for app container and registers connection destination information in SDS API.

The configuration around the metrics is as follows:
- Store all metrics to Prometheus
- Send tagged metrics to statsd_exporter running on the ECS container host instance using dog_statsd sink*5
- All metrics include application id via fixed-string tags to identify each node*6
- Prometheus pulls metris using EC2 SD
- To manage port for Prometheus, we use exporter_proxy between statsd_exporter and Prometheus
- Vizualize metrics with Grafana and Vizceral
In case the application process runs directly on the EC2 instance without using ECS or Docker, the Envoy process is running as a daemon directly in the instance, but the architecture is almost the same. There is a reason for not setting pull directly from Prometheus to Envoy, because we still can not extract histogram metrics from Envoy's Prometheus compatible endpoint*7. As this will be improved in the future, we plan to eliminate stasd_exporter at that time.

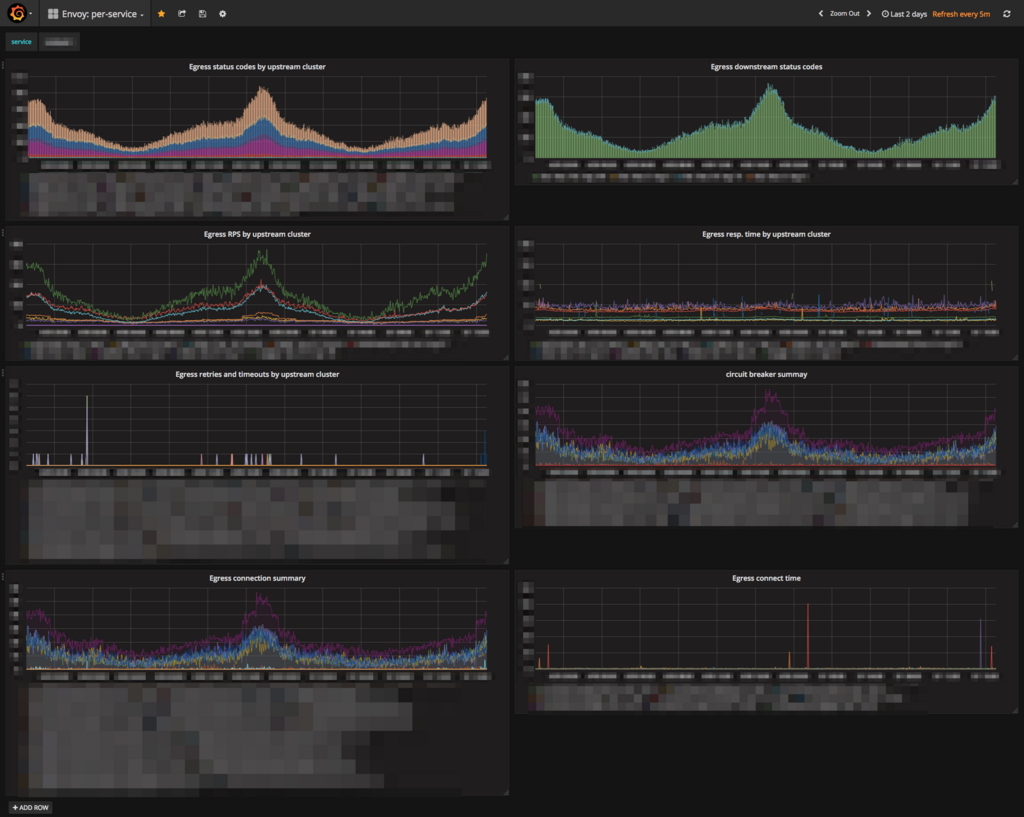
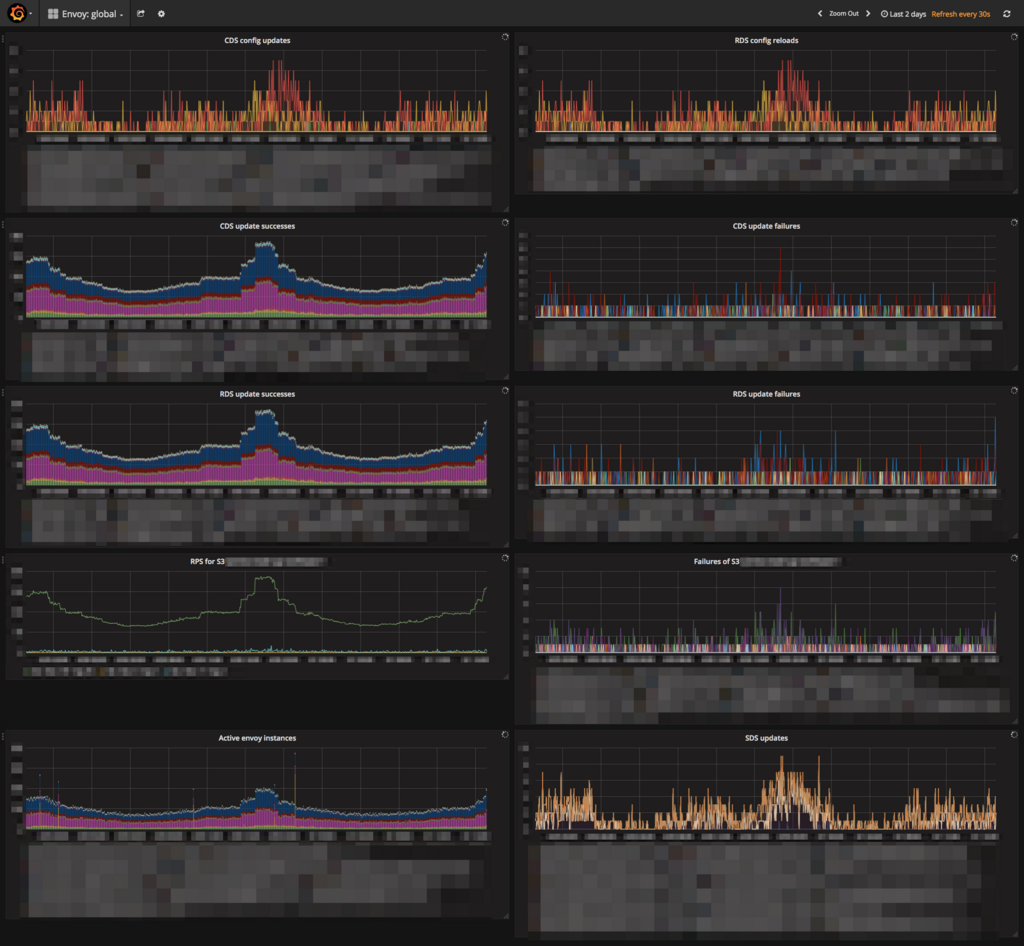
On Grafana, dashboards and Envoy's entire dashboard are prepared for each service, such as upstream RPS and timeout occurrence. We will also prepare a dashboard of the service x service dimension.
Per service dashboard:

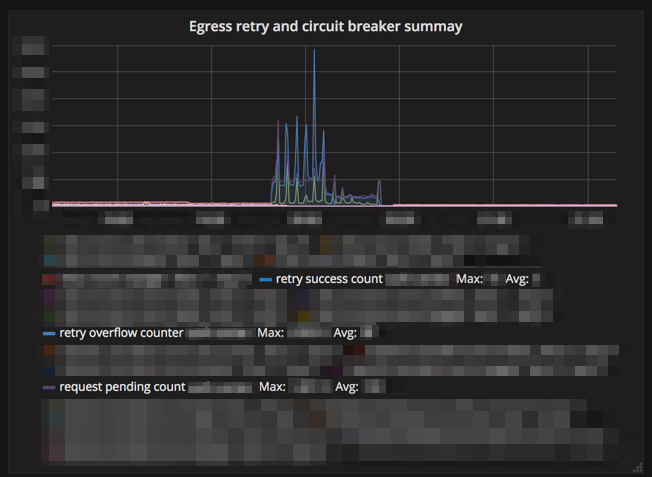
For example, circuit breaker related metrics when the upstream is down:

Dashboard for envoys:

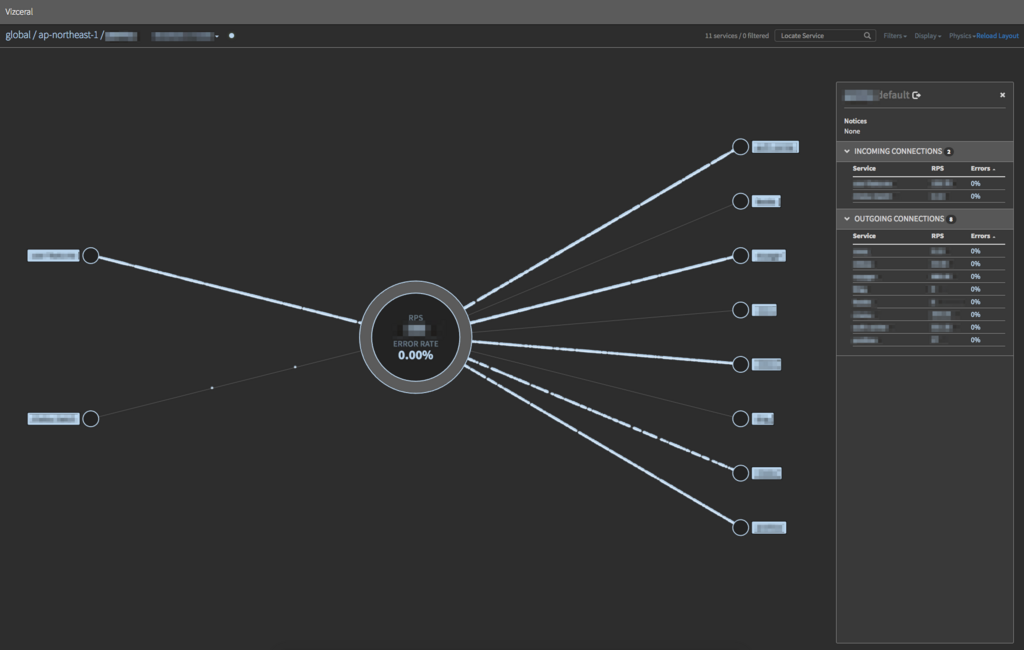
The service configuration is visualized using Vizceral developed by Netflix. For implementation, we developed fork of promviz and promviz-front*8. As we are introducing it only for some services yet, the number of nodes currently displayed is small, but we provide the following dashboards.
Service configuration diagram for each region, RPS, error rate:

Downstream / upstream of a specific service:

As a subsystem of the service mesh, we deploy a gateway for accessing the gRPC server application in the staging environment from the developer machine in our offices*9. It is constructed by combining SDS API and Envoy with software that manages internal application called hako-console.
- Gateway app (Envoy) sends xDS API request to gateway controller
- The Gateway controller obtains the list of gRPC applications in the staging environment from hako-console and returns the Route Discovery Service / Cluster Discovery Service API response based on it
- The Gateway app gets the actual connection destination from the SDS API based on the response
- From the hand of the developer, the AWS ELB Network Load Balancer is referred to and the gateway app performs routing

Results
The most remarkable in the introduction of service mesh was that it was able to suppress the influence of temporary disability. There are multiple cooperation parts between services with many traffic, and up to now, 200+ network-related trivial errors*10 have been constantly occurring in an hour*11, it decreased to about whether it could come out in one week or not with the proper retry setting by the service mesh.
Various metrics have come to be seen from the viewpoint of monitoring, but since we are introducing it only for some services and we have not reached full-scale utilization due to the introduction day, we expect to use it in the future. In terms of management, it became very easy to understand our system when the connection between services became visible, so we would like to prevent overlooking and missing consideration by introducing it to all services.
Future plan
Migrate to v2 API, transition to Istio
The xDS API has been using v1 because of its initial design situation and the requirement to use S3 as a delivery back end, but since the v1 API is deprecated, we plan to move this to v2. At the same time we are considering moving control-plane to Istio. Also, if we are going to make our own control-plane, we plane to build LDS/RDS/CDS/EDS API*12 using go-control-plane.
Replacing Reverse proxy
Up to now, Cookpad uses NGINX as reverse proxy, but considering replacing reverse proxy and edge proxy from NGINX to Envoy considering the difference in knowledge of internal implementation, gRPC correspondence, and acquisition metrics.
Traffic Control
As we move to client-side load balancing and replace reverse proxy, we will be able to freely change traffic by operating Envoy, so we will be able to realize canary deployment, traffic shifting and request shadowing.
Fault injection
It is a mechanism that deliberately injects delays and failures in a properly managed environment and tests whether the actual service group works properly. Envoy has various functions *13.
Perform distributed tracing on the data-plane layer
In Cookpad, AWS X-Ray is used as a distributed tracing system*14. Currently we implement the distributed tracing function as a library, but we are planning to move this to data-plane and realize it at the service mesh layer.
Authentication Authorization Gateway
This is to authenticate and authorize processing only at the front-most server receiving user's request, and the subsequent servers will use the results around. Previously, it was incompletely implemented as a library, but by shifting to data-plane, we can recieve the advantages of out of process model.
Wrapping up
We have introduced the current state and future plan of service mesh in Cookpad. Many functions can be easily realized already, and as more things can be done by the layer of service mesh in the future, it is highly recommended for every microservices system.
*1:https://blog.twitter.com/engineering/en_us/a/2013/observability-at-twitter.html
*2:https://medium.com/@copyconstruct/monitoring-and-observability-8417d1952e1c
*3:Our gRPC applications already use this mechanism in a production environment
*4:Server-side load balancing which simply use Internal ELB (NLB or TCP mode CLB) has disadvantages in terms of performance due to unbalanced balancing and also it is not enough in terms of metrics that can be obtained
*5:https://www.envoyproxy.io/docs/envoy/v1.6.0/api-v2/config/metrics/v2/stats.proto#config-metrics-v2-dogstatsdsink . At first I implemented it as our-own extension, but later I sent a patch: https://github.com/envoyproxy/envoy/pull/2158
*6:This is another our work: https://github.com/envoyproxy/envoy/pull/2357
*7:https://github.com/envoyproxy/envoy/issues /1947
*8:For the convenience of delivering with NGINX and conforming to the service composition in the Cookpad
*9:Assuming access using client-side load balancing, we need a component to solve it.
*10:It's very small number comparing to the traffic.
*11:Retry is set up in some partes though.
*12:https://github.com/envoyproxy/data-plane-api/blob/5ea10b04a950260e1af0572aa244846b6599a38f/API_OVERVIEW.md#apis
*13:https://www.envoyproxy.io/docs/envoy/v1.6.0/configuration/http_filters/fault_filter.html